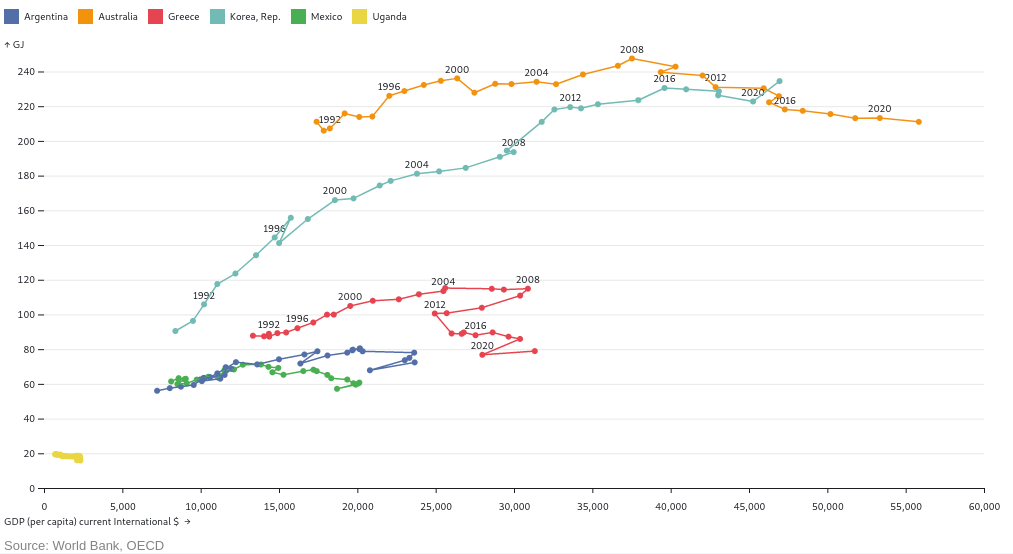
Total Primary Energy Supply vs GDP per capita (1990 - 2021)
Conor Redington
What are the relevant factors to be taken into account for this comparison?
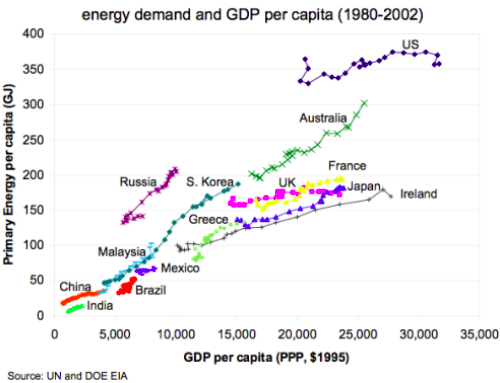
- In the graph from the lecture slides (shown on last page), GDP per capita is measured with the international dollar from 1995. This is the value of a 1995 US dollar adjusted for price levels. A US dollar in 1995 is worth about 1.94 current US dollars. If we take the example of Mexico. In the lecture slide graph it’s GDP finishes (in 2002) at around 8000 1995 dollars which using a 1.94 conversion rate is about 15,000 2022 dollars. We can see this in the main graph as Mexico starts around this value. How GDP changes for country will be taken from the updated graph using current international dollars because it takes into account changes in the products you can buy e.g. you couldn’t really buy an iPhone with 1995 dollars.
- Energy Usage seems to be distorted for Australia from the graph in the slides. In the main graph the value hovers between 220 and 240 GJ for the early 2000’s whereas for the slide graph it’s approximately 300GJ in 2002. This is a large difference, maybe the population data used is different or energy statistics have been revised. For instance, taking the population in Australia in 2002 as 19,651,400 from the World Bank and the Primary energy supply from the OECD in 20021 as approximately GJ (109 Mtoe) from the OECD, the GJ per capita is around 232GJ, the IEA has a value of GJ for primary energy supply so that the GJ per capita is also approximately 230GJ.
\newpage
Australia
- As mentioned above the comparison for Australia to the lecture slides may not be accurate for energy demand comparisons. Australia’s energy demand has been growing at a rate of 0.2% annually in the last ten years 2
- It’s GDP has doubled in the last 20 years which is not surprising as Australia is known as never really having a recession.
Mexico
- Mexico’s GDP has grown by about 25% while it’s energy usage has remained relatively constant.
- Despite Mexico’s population growing at a fast rate it’s energy consumption has been reducing by -1.2% annually in the last ten years.
Uganda
- Uganda is one of the worlds poorest countries and it’s interesting to note how it’s energy usage is completely dwarfed by those of developed and developing economies. It barely appears on the bottom left of the above graph. Uganda, like many African countries has a high population growth rate.
Greece
 { height=200}
- Greece had major setbacks as an economy from the Global Financial Crisis of 2008 and it’s interesting to note this in it’s energy usage as a measure of the austerity it faced and how it’s never really recovered.
Korea
- Korea has expected reductions in growth during the 1990’s due to the Asian Financial crisis but it has continued on the same trend of growth as that of the graph in the lecture slides similar to a lot of Asian countries in the past 20 years.
- It’s growth rate in the last decade has been 0.9% annually which is still nothing in comparison to China’s 3.4%.
- Australia and Korea don’t seem to have been affected by the global pandemic in 2020 as much as other countries in terms of GDP per capita.
Footnotes
-
Primary energy supply is defined as energy production plus energy imports, minus energy exports, minus international bunkers, then plus or minus stock changes. This is the definition used by the OECD where the primary energy supply data was taken from IEA which uses the same definition. Primary energy is considered demand by a country. There are discrepancies this value as its based on a determined thermal efficiency of the underlying energy sources. Conversion used is 1 Toe = 41.86GJ ↩
-
All growth rates in energy supply taken from the following report: https://www.bp.com/content/dam/bp/business-sites/en/global/corporate/pdfs/energy-economics/statistical-review/bp-stats-review-2022-full-report.pdf ↩